
TraceCLI: a production debugging and tracing tool
Ever had this application that just crashed or malfunctioned in a Production environment ? And whatever you tried, it wasn’t reproducible in Test ? Or perhaps it was just slow in serving some pages (web application), and you wanted to see the actual SQL your Object Relational Model (ORM) generated and sent to the database ?
Well, there are some options.
For one, you could add more logging. Typically though, Murphy’s Law interferes and even though you think you log ’everything’, you find out when you really need it you forgot about that one spot, or need more detail (like argument or field values). Changing the code and building a new release, not to mention get it through Test, Acceptance and into Production is not really an attractive option here.
An alternative is to use WinDbg (+ SOS) on a crashdump obtained using a GUI app like DebugDiag or a command line app like ProcDump. For real crashes this ‘post mortem debugging’ option is often sufficient: you’ll have a full memory dump to work with taken at the exact time of the crash so all the details are there. However, using WinDbg is a pretty hardcore skill not every (.NET) developer has, and for more subtle malfunctions - for instance your application not behaving nicely with other systems - or in case of performance issues, you typically want to inspect a live target anyway.
And here it becomes problematic: I probably don’t have to tell you attaching a debugger to a live production process and stepping through it is not a good idea. Although even without WinDbg there’s still a large set of tools at your disposal (SQL tracing/profiling, performance counters, ETW tracing), those are mostly indirect and slow to setup: you’re watching symptoms instead of the real disease.
What I really wanted was a tool which I can attach to a live target without disrupting it, and in which I can specify some classes, methods or even namespaces to monitor (hitcounts, timings). Perhaps I even want to dump some (private) fields of a class when a method is hit. That sort of thing.
It didn’t exist (or I couldn’t find it), and I was searching for a challenge anyway, so I made one myself using native C++ and the debugging APIs.
The tool - for now named TraceCLI - allows you to live attach to a process (x86 or x64), and instrument the namespaces, classes, and methods you want. On hitting them, you can either just monitor their hitcounts or do more advanced stuff like measure the time in the method (for now including calls to other methods), as well as dump fields of the class the method is a member of on entering the method. For simple much used scenarios, there are presets (like SQL tracing) and for very advanced scenarios or multiple hit filter settings, you can also provide a configuration with an xml config file.
Although ultimately the goal is to use it on production processes, it’s still very alpha, both in terms of stability as well as feature set. So please use at your own risk.
Example: SQL tracing
For example, to trace SQL queries manually (without a preset), we could use the following commandline:
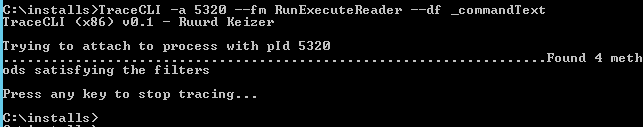
which specifies we want to dump the field ‘_commandText’ of a class with a method ‘RunExecuteReader’ upon entering the method.
During startup, TraceCLI attaches to the process and checks all loaded assemblies for such methods, and instruments them:
14:33:53.588 TraceCLI (x86) v0.1 - Ruurd Keizer
14:33:53.588 ### PARAMETERS
14:33:53.589 Filter #1: namespace (null), class (null), method RunExecuteReader.
14:33:53.589   Fields dumped on entry: _commandText
14:33:53.658 ### ATTACH
14:33:53.659 Attaching to process with pId 5320: C:\Program Files (x86)\IIS Express\iisexpress.exe
14:33:53.738 Processing filter...
14:33:53.739 Searching domain: DefaultDomain
14:33:53.739 Searching assembly: C:\Windows\Microsoft.Net\assembly\GAC_MSIL\System.Configuration\v4.0_4.0.0.0__b03f5f7f11d50a3a\System.Configuration.dll
14:33:53.755 Searching assembly: C:\Windows\Microsoft.Net\assembly\GAC_MSIL\System.Core\v4.0_4.0.0.0__b77a5c561934e089\System.Core.dll
14:33:53.800 Searching assembly: C:\Windows\Microsoft.Net\assembly\GAC_MSIL\Microsoft.Build.Utilities.v4.0\v4.0_4.0.0.0__b03f5f7f11d50a3a\Microsoft.Build.Utilities.v4.0.dll
(...)
14:33:54.077 Searching domain: /LM/W3SVC/4/ROOT-1-130487604823520283
14:33:54.078 Searching assembly: C:\Windows\Microsoft.Net\assembly\GAC_MSIL\System.Data.Linq\v4.0_4.0.0.0__b77a5c561934e089\System.Data.Linq.dll
14:33:54.093 Searching assembly: C:\Windows\Microsoft.NET\Framework\v4.0.30319\Temporary ASP.NET Files\root\4ecd037f\b8cc2ad2\assembly\dl3\2c89eab9\1cd35552_3295cf01\Solvay.Common.dll
14:33:54.094 Searching assembly: C:\Windows\Microsoft.Net\assembly\GAC_MSIL\Microsoft.Web.Infrastructure\v4.0_1.0.0.0__31bf3856ad364e35\Microsoft.Web.Infrastructure.dll
(...)
14:33:54.796 Searching assembly: C:\Windows\Microsoft.NET\Framework\v4.0.30319\Temporary ASP.NET Files\root\4ecd037f\b8cc2ad2\assembly\dl3\5283b6cf\d83f43ef_2d8acf01\System.Web.Http.WebHost.dll
14:33:54.798 Searching assembly: C:\Windows\Microsoft.Net\assembly\GAC_32\mscorlib\v4.0_4.0.0.0__b77a5c561934e089\mscorlib.dll
14:33:54.902 Found 4 methods satisfying the filters
14:33:54.902 Found method: internal System.Data.SqlClient.SqlDataReader System.Data.SqlClient.SqlCommand::RunExecuteReader(System.Data.SqlClient.SqlDataReader, System.Data.SqlClient.SqlDataReader, System.Data.SqlClient.SqlDataReader, System.Data.SqlClient.SqlDataReader) cil managed
14:33:54.903 Found method: internal System.Data.SqlClient.SqlDataReader System.Data.SqlClient.SqlCommand::RunExecuteReader(System.Data.SqlClient.SqlDataReader, System.Data.SqlClient.SqlDataReader, System.Data.SqlClient.SqlDataReader, System.Data.SqlClient.SqlDataReader, System.Data.SqlClient.SqlDataReader, System.Data.SqlClient.SqlDataReader, System.Data.SqlClient.SqlDataReader, System.Data.SqlClient.SqlDataReader) cil managed
14:33:54.903 Found method: private System.Data.SqlClient.SqlDataReader System.Data.SqlClient.SqlCommand::RunExecuteReaderTds(System.Data.SqlClient.SqlDataReader, System.Data.SqlClient.SqlDataReader, System.Data.SqlClient.SqlDataReader, System.Data.SqlClient.SqlDataReader, System.Data.SqlClient.SqlDataReader, System.Data.SqlClient.SqlDataReader, System.Data.SqlClient.SqlDataReader, System.Data.SqlClient.SqlDataReader) cil managed
14:33:54.903 Found method: private System.Data.SqlClient.SqlDataReader System.Data.SqlClient.SqlCommand::RunExecuteReaderSmi(System.Data.SqlClient.SqlDataReader, System.Data.SqlClient.SqlDataReader, System.Data.SqlClient.SqlDataReader) cil managed
14:33:54.904 Activating all breakpoints
While the tool is attached it dumps SQL to the log as it executes it:
14:33:54.904 ### TRACING
14:34:00.617 Field: private string System.Data.SqlClient.SqlCommand::_commandText, Value: SELECT
    [GroupBy1].[A1] AS [C1]
    FROM ( SELECT
        COUNT(1) AS [A1]
        FROM  [dbo].[T_Computer] AS [Extent1]
        INNER JOIN [dbo].[T_OS] AS [Extent2] ON [Extent1].[HWComputerIndex] = [Extent2].[ComputerIndex]
    )  AS [GroupBy1]
14:34:00.626 Field: private string System.Data.SqlClient.SqlCommand::_commandText, Value: SELECT
    [GroupBy1].[A1] AS [C1]
    FROM ( SELECT
        COUNT(1) AS [A1]
        FROM  [dbo].[T_Computer] AS [Extent1]
        INNER JOIN [dbo].[T_OS] AS [Extent2] ON [Extent1].[HWComputerIndex] = [Extent2].[ComputerIndex]
    )  AS [GroupBy1]
14:34:00.635 Field: private string System.Data.SqlClient.SqlCommand::_commandText, Value: SELECT
    [GroupBy1].[A1] AS [C1]
    FROM ( SELECT
        COUNT(1) AS [A1]
        FROM ( SELECT DISTINCT
            [Extent1].[SlaSID] AS [SlaSID],
            [Extent1].[SlaInfo] AS [SlaInfo],
            [Extent1].[SLaTeam] AS [SLaTeam],
            [Extent1].[SlaSource] AS [SlaSource]
            FROM [dbo].[T_SID_SLA_DRP] AS [Extent1]
            WHERE ( NOT ((N'int' = [Extent1].[SLaTeam]) AND ([Extent1].[SLaTeam] IS NOT NULL))) AND ( NOT ((N'wintel' = [Extent1].[SlaSource]) AND ([Extent1].[SlaSource] IS NOT NULL)))
        )  AS [Distinct1]
    )  AS [GroupBy1]